
How to Look Up Volusia County Jail Population Data
The primary source for Volusia County jail population data is the Volusia County Division of Corrections, which publishes an annual report covering average daily population, design capacity, incarceration rates, and demographic breakdowns. That report is the controlling county source and is the basis for the local figures shown here. The county corrections website at volusia.org/corrections lists current agency information, contacts, and links to published data. Annual reports are typically available through the county government document portal. The Bureau of Justice Statistics publishes its own annual Jail Inmates report, which covers national totals, state-level aggregates, and trend data going back decades. BJS data has a lag of roughly one to two years because the survey results take time to compile and verify.
When reading population data from any of these sources, it helps to know which numbers are county-specific and which are drawn from state or national surveys. The VCDC annual report figures are Volusia County only. BJS rates and Vera Institute trend data are built from survey responses and may not match the county's own count exactly, since methodology and survey timing differ. The Vera Institute's Incarceration Trends tool allows county-level comparisons over multiple years using data drawn from the BJS Annual Survey of Jails. For a current daily count of who is physically in custody, the live inmate inquiry at volusiamug.vcgov.org reflects the booking roster, not a population statistic.
Volusia County Jail Capacity Overview
The Volusia County jail system runs two facilities, both located off U.S. 92 west of I-95 near Daytona Beach. Together they hold a combined design capacity of 1,494. Design capacity is the number of inmates a facility was built to hold; actual population can run higher or lower on any given day. The 2024 Corrections Annual Report places the 2024 average daily population at 1,345, which is roughly 90 percent of combined design capacity. That means the system was not overcrowded on average during 2024, though individual days and individual facilities may have seen different figures. The table below shows each facility's design capacity and primary population role as reported in official county data. (County-specific data.)
| Facility | Design Capacity | Primary Population Role |
|---|---|---|
| Volusia County Branch Jail | 899 | Pretrial, state sentenced, medium/high custody non-sentenced males; bond and first appearances |
| Volusia County Correctional Facility | 595 | County sentenced, low/medium custody males, all female inmates |
| Combined total | 1,494 | Full county jail system |
The Branch Jail at 1300 Red John Drive handles the highest-custody population and is where bond is posted and first appearances are held. The Correctional Facility at 1354 N. Indian Lake Road is the lower-custody unit and also houses all female inmates regardless of charge type.
Note: Design capacity figures are from the 2024 VCDC Annual Report and represent county-specific data, not a statewide or national estimate.
2024 Average Daily Population
Average daily population, or ADP, is the standard measure used by jail administrators and researchers to track how many people are in custody on a typical day. The 2024 Corrections Annual Report for Volusia County puts the ADP at 1,345. Against the combined design capacity of 1,494, that yields a utilization rate of about 90 percent. An ADP of 1,345 does not mean 1,345 specific individuals were confined all year. People cycle through jail on short holds, bond releases, court transfers, and sentence completions, so the total number of people booked in a year is considerably higher than the ADP. ADP is a snapshot of how full the jail is on an average day, not a count of unique individuals.
For researchers comparing trends, the incarceration rate is often more useful than the raw ADP because it adjusts for population size. Volusia County reported a rate of 2.26 incarcerated persons per 1,000 county residents in 2024. That rate had been 2.45 per 1,000 in 2022 and 2.24 per 1,000 in 2023, indicating a drop from 2022 to 2023 and a slight rise in 2024. All three figures are drawn from the VCDC annual report and are county-specific. (County-specific data.)
Incarceration Rate Trend
The three-year window of official data shows a range between 2.24 and 2.45 per 1,000 residents. The drop from 2022 to 2023 was the larger move; the change from 2023 to 2024 was small. Whether the trend reflects changes in arrest rates, bail practices, case processing speed, or county population growth is not stated in the annual report data located for this research. Each of those factors can shift an incarceration rate independently.
For longer trend analysis, the Vera Institute's county incarceration data tool covers many counties going back to 1970 using BJS survey data. Vera's numbers may differ slightly from the official VCDC report due to methodology differences, but the directional trend is generally consistent. BJS also publishes state and national rates annually in its Jail Inmates bulletin, which is available free through the BJS website. (Vera and BJS data are state/national context sources; the VCDC report controls for local figures.)
| Year | Volusia County Rate (per 1,000 residents) | Source |
|---|---|---|
| 2022 | 2.45 | VCDC Annual Report (county-specific) |
| 2023 | 2.24 | VCDC Annual Report (county-specific) |
| 2024 | 2.26 | VCDC Annual Report (county-specific) |
Facility Roles in the Volusia County Jail System
The two facilities serve different custody levels and populations, which matters when reading aggregate data. The Branch Jail is the intake point. It handles all new bookings, first appearances before a magistrate, and bond processing. It also holds the medium- and high-custody non-sentenced male population, including people awaiting trial on serious charges and people waiting transfer to state prison. The Booking Office at the Branch Jail is open 24/7 for bond posting and arrest inquiries.
The Correctional Facility takes lower-custody men after initial processing and holds all female inmates at every custody level. That means a woman sentenced on a felony and a woman held pretrial on a misdemeanor both land at the Correctional Facility, not at the Branch Jail. The separation by facility also means that capacity pressure does not fall evenly on both buildings. If the male pretrial population grows, the Branch Jail absorbs the increase; if the female population grows, it shows up at the Correctional Facility. Neither facility operates as an overflow unit for the other.
Demographic Breakdown of Volusia County Inmates
The 2024 VCDC Annual Report provides demographic data on the county jail population. Gender and race figures are drawn from bookings data. About 73 percent of inmates booked were male and about 27 percent female. By race and sex, the largest group was white males at 48 percent of the total, followed by black males at 23 percent. The report does not break out every sub-group or age range in the data located for this research, so the table below covers the groups where official percentages are available. All figures are county-specific from the 2024 annual report.
| Group | Share of Booked Population | Source |
|---|---|---|
| Male (all) | ~73% | VCDC 2024 Annual Report |
| Female (all) | ~27% | VCDC 2024 Annual Report |
| White males | 48% | VCDC 2024 Annual Report |
| Black males | 23% | VCDC 2024 Annual Report |
Nationally, Black people are jailed at a rate roughly four times that of white people when adjusted for population, according to BJS Jail Inmates data. Volusia County's 2024 figures show white males as the largest single group in absolute terms, which reflects the county's overall racial composition, where white residents make up the majority. Comparing raw shares to national rates requires demographic adjustment and is outside the scope of the county report data. (BJS figures above are national context, not county-specific.)
Pretrial and Sentenced Population
Jail populations are typically split between people who have not yet been convicted, sometimes called pretrial detainees, and people serving a sentence. In most county jails nationally, pretrial detainees make up a large share, often more than half. BJS data consistently shows that pretrial status accounts for roughly 65 to 70 percent of the national jail population in recent survey years. That figure is a national estimate; the VCDC 2024 Annual Report data located for this research does not publish an explicit pretrial-versus-sentenced percentage breakdown, so no county-specific split can be stated here. The facility structure gives a rough indication: the Branch Jail primarily holds pretrial and non-sentenced individuals, while the Correctional Facility primarily holds county-sentenced and lower-custody individuals. The combined capacity split (Branch Jail 899, Correctional Facility 595) suggests a heavier weight on the non-sentenced side, consistent with national norms.
| Population Category | Primary Facility | Notes |
|---|---|---|
| Pretrial / non-sentenced males | Branch Jail (capacity 899) | Also includes state sentenced awaiting transfer |
| County sentenced males | Correctional Facility (capacity 595) | Low/medium custody |
| All female inmates | Correctional Facility | Both pretrial and sentenced |
Note: The ~65-70% pretrial figure cited above is a national BJS estimate, not a Volusia County-specific number; no county-specific pretrial split was located in the 2024 VCDC report data.
National and State Context
Putting Volusia County's incarceration rate alongside state and national figures gives a sense of where the county sits. Volusia County reported 2.26 per 1,000 residents in 2024, which translates to roughly 226 per 100,000. That figure is county-specific from the VCDC annual report. For comparison, BJS estimates that Florida held about 225 to 230 jail inmates per 100,000 residents in recent survey years, placing Volusia County near the state average. Nationally, the BJS Jail Inmates bulletin has placed the U.S. jail rate at roughly 220 to 230 per 100,000 in recent years. The Prison Policy Initiative's Florida profile, which draws from Census and BJS data, notes that Florida's combined incarceration rate (jail plus prison) is above the national median. These state and national figures are context only; they are not county-specific and should not be used to infer a precise Volusia County ranking.
| Level | Approximate Jail Rate (per 100,000) | Source / Notes |
|---|---|---|
| Volusia County (2024) | ~226 | VCDC Annual Report (county-specific; 2.26 per 1,000 converted) |
| Florida (recent) | ~225-230 | BJS Annual Survey of Jails (state aggregate, not county-specific) |
| United States (recent) | ~220-230 | BJS Jail Inmates bulletin (national estimate, not county-specific) |
The Prison Policy Initiative maintains a Florida incarceration profile that breaks down state jail and prison data with charts and historical trend lines. That resource is useful for understanding how Florida's overall incarceration picture compares to other states, but it does not replace the VCDC annual report as the authoritative source for Volusia County numbers. (BJS, Vera, and Prison Policy Initiative data are state/national context sources.)
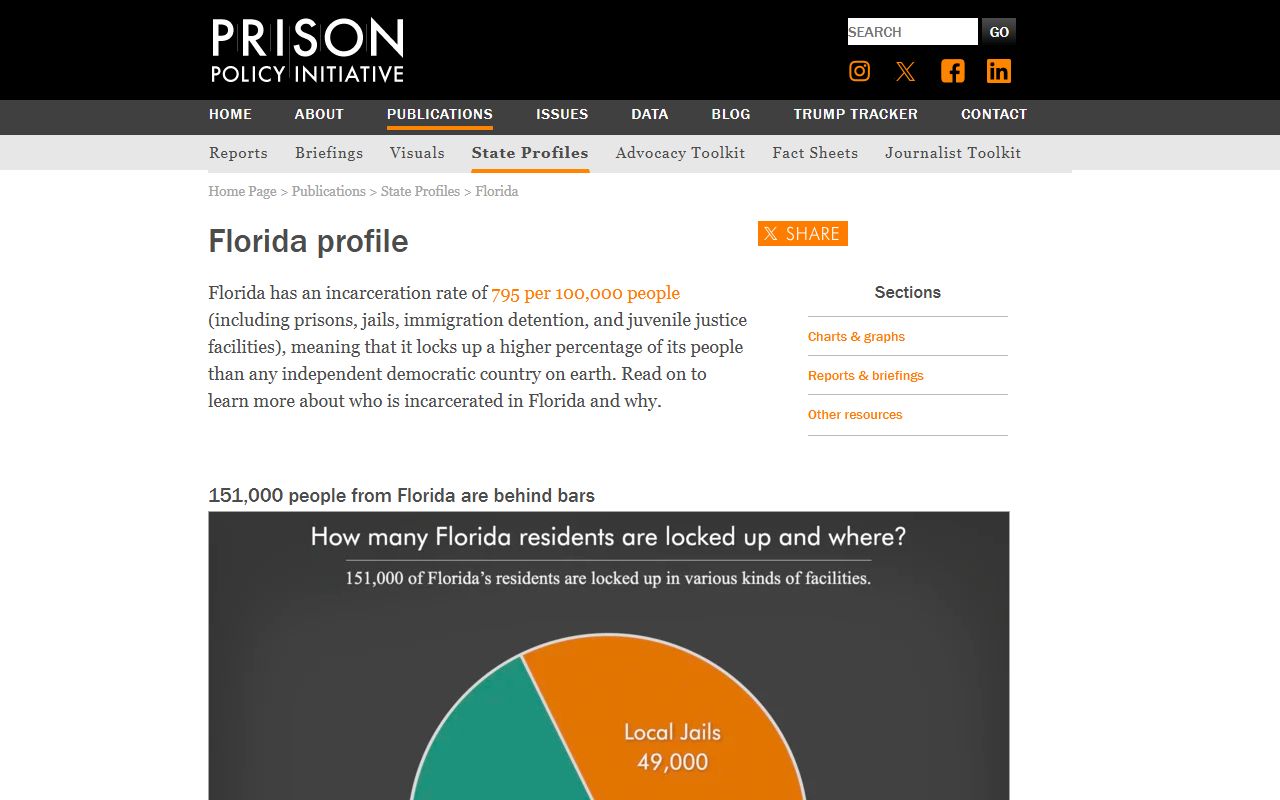
The profile page above shows Florida's incarceration trends and how the state compares to the national average across multiple years.
Population Trends Over Time
The official data available for this research covers 2022 through 2024. That three-year window shows a dip in 2023 followed by a slight uptick in 2024. In 2022, the incarceration rate was 2.45 per 1,000 residents. It fell to 2.24 in 2023 and then edged back to 2.26 in 2024. The 2024 ADP of 1,345 is the only single-year ADP figure available in the sources located; year-over-year ADP comparisons require archived annual reports that were not retrieved for this research. For a longer view, Vera Institute trend data going back to the 1970s is available through their county incarceration tool. Vera's methodology differs from the VCDC report, so absolute numbers may not match, but the directional pattern is useful for context.
Nationally, jail populations fell sharply during 2020 due to COVID-19 emergency releases and reduced arrests. BJS data shows a partial rebound from 2021 onward, and most jurisdictions have not returned to pre-pandemic levels. Whether Volusia County followed that same arc is not fully documented in the data located for this research. The 2022-to-2024 VCDC rate range of 2.24 to 2.45 per 1,000 residents suggests the county was operating at a moderate and relatively stable level during that period, without the sharp swings seen in some larger urban jail systems during the same years. (BJS national trend observations are national context, not Volusia County-specific.)
The Florida Department of Corrections also maintains offender data at the state level for people sentenced to state prison rather than county jail. For sentenced inmates who have moved from Volusia County custody to state prison, the FDC offender search tracks current location and sentence data.
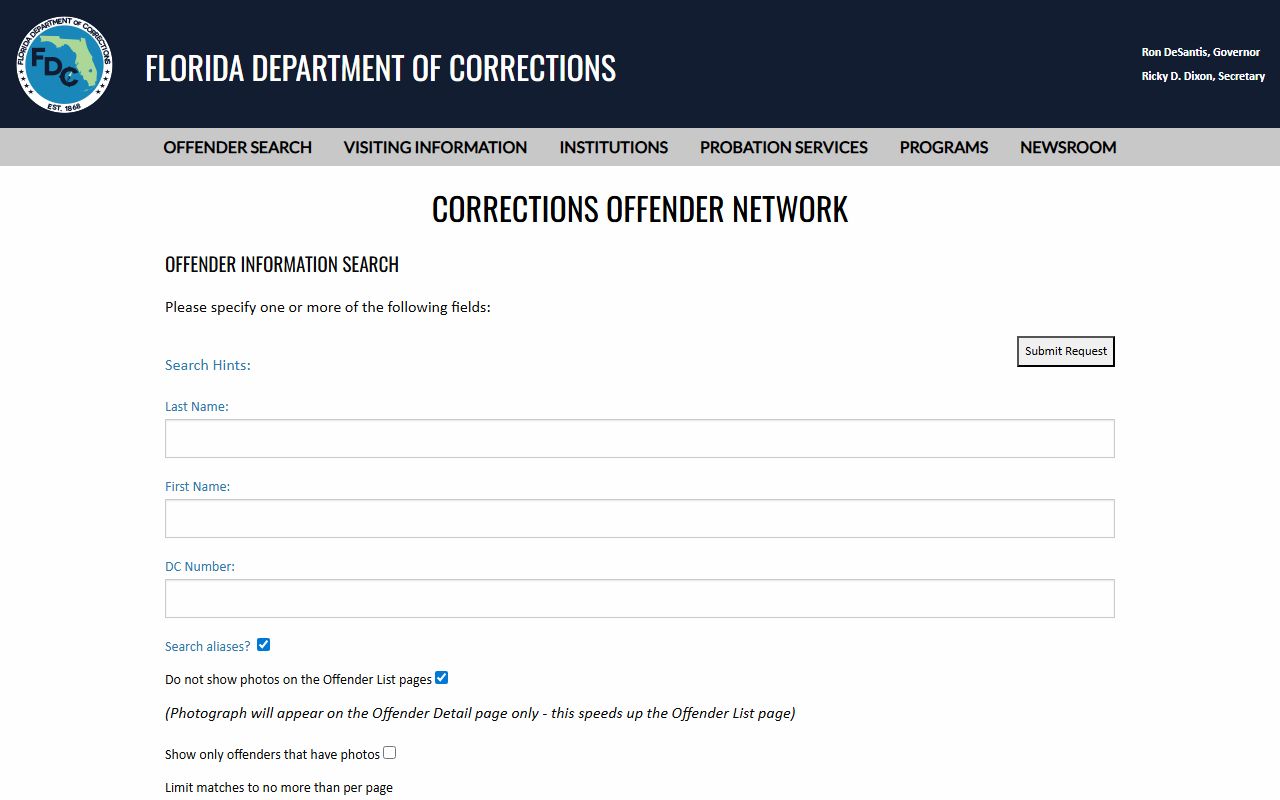
The Florida DOC offender search covers inmates currently held in state facilities and those under community supervision, which is a separate population from the county jail roster. See released inmates for more on tracing people who have left Volusia County custody.
Searching for Volusia County Inmate Records by Name
The figures above are aggregate population statistics, not individual inmate records. For a name-based search of the live jail roster, including current booking status, charges, and bond information, use the Volusia County inmate records page, which covers the online booking inquiry portal, how to use it, and what the profile fields show.
Where the Data Comes From
All Volusia County-specific figures cited come from the 2024 Volusia County Division of Corrections Annual Report: the 1,494 combined design capacity (Branch Jail 899, Correctional Facility 595), the 2024 ADP of 1,345, the three-year incarceration rate series of 2.45 / 2.24 / 2.26 per 1,000 residents, and the demographic percentages for gender and race. That report is produced by the Division of Corrections and is the authoritative county source. It is separate from the Sheriff's Office, which does not run the jails.
State and national context figures come from three external sources. The Bureau of Justice Statistics publishes the Annual Survey of Jails and the Jail Inmates bulletin, which are the standard academic and policy sources for jail population comparisons across states and counties. The Vera Institute of Justice maintains an Incarceration Trends database that uses BJS survey data and allows county-level trend comparisons going back decades. The Prison Policy Initiative provides state-level incarceration profiles that include jail and prison data alongside demographic and policy context. None of these three external sources replace the VCDC annual report as the source of record for Volusia County population figures. Researchers should cite the county report for any Volusia-specific claim and clearly label BJS or Vera data as national or state context.
For underlying criminal records tied to individual cases in the jail, the Clerk of the Circuit Court maintains court case files accessible through the Case Inquiry portal. Questions about the annual report or corrections data can be directed to the Volusia County Division of Corrections. For site-level questions and general court record guidance, see the FAQ.